Visuals add interest, engagement to your business’ 2023 highlights
Dec. 11, 2023
This paid piece is sponsored by Lemonly.
For many businesses, publishing an annual report is a part of wrapping up each year. Using visual content in your annual report can help add personality and polish that wows stakeholders, customers and the public.
Creating annual reports that make an impact
An annual report is a piece of content that tells the story of your year. Whether it takes the form of an official-looking document or an eye-catching visual, its job is to showcase the important milestones and metrics that summarize your business’ year.
Annual reports are a key opportunity for many companies to level up their content. Lemonly, a Sioux Falls-based creative agency, specializes in visual storytelling that helps brands make their messages clear, compelling and beautiful through visual content like infographics, videos and branding. That includes crafting bespoke annual reports in a variety of formats for clients in finance, health care, tourism and many other industries.
“We help all kinds of organizations — from small nonprofits to industry titans — make an impact through visual content that makes their story easy to understand, fun to consume and consistent with their brand,” said Nick Lorang, senior marketing and communication manager.
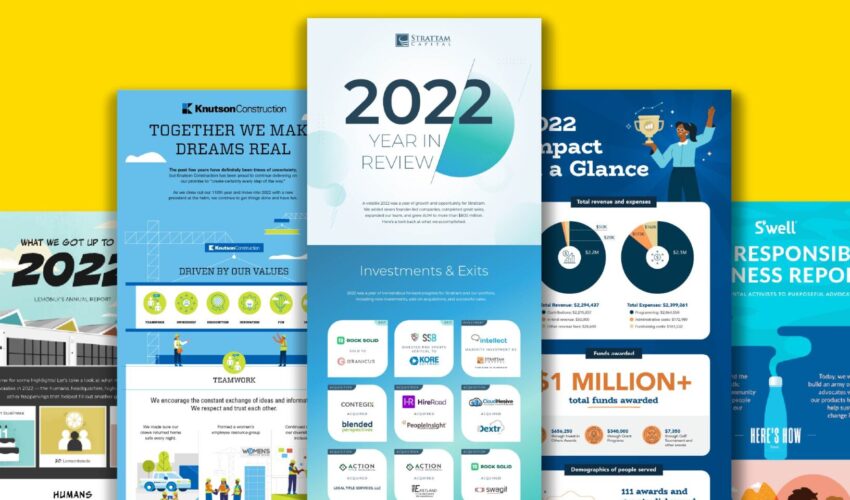
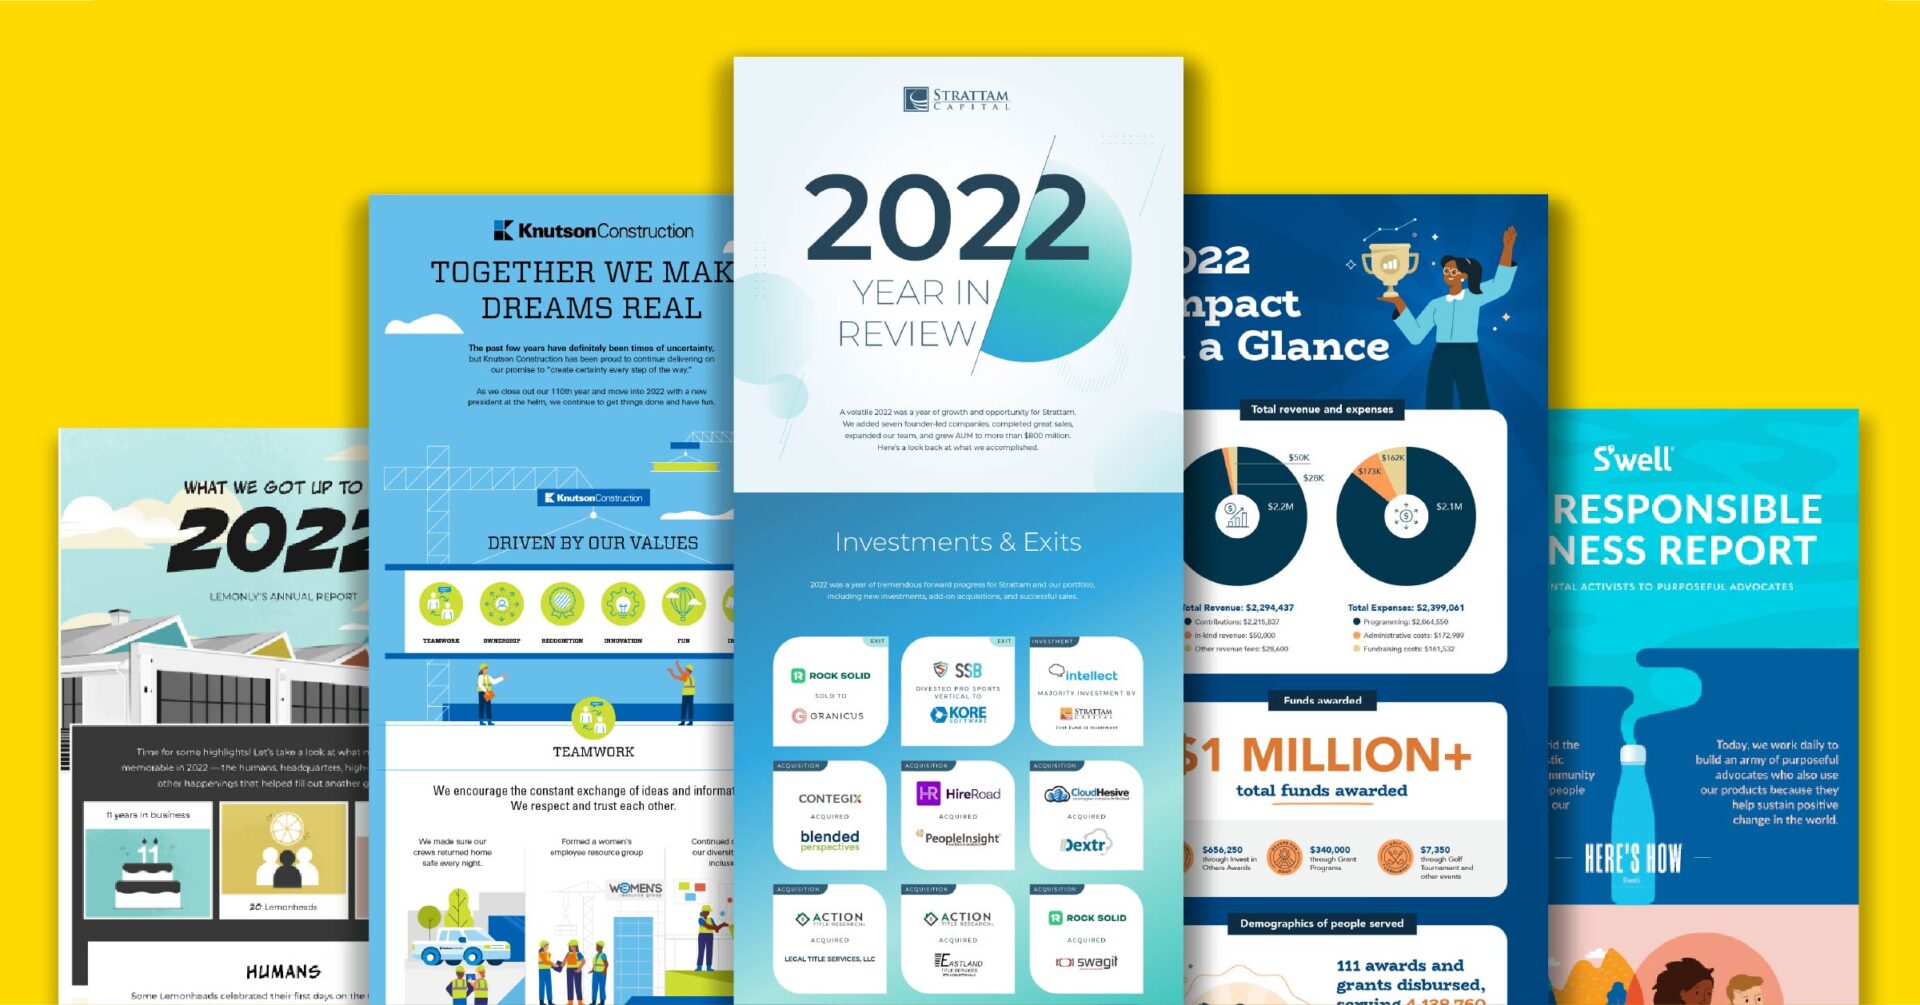
“Traditional annual reports are often plain or tedious and might be in a format that isn’t great for online consumption. Lemonly creates vibrant, visual annual reports in a variety of digital formats, from infographics to immersive microsites.”
No matter what format an annual report takes, Lemonly can make it visual. The agency has designed eye-catching annual reports for major corporations like FOX and smaller nonprofits like FaceItTogether. For companies of any size, visual content is key to an engaging report.
Using visuals to increase engagement and retention
Visual content adds clarity to the information presented in an annual report. You might clarify key data with visual elements like charts and graphs. Designing an annual report with a clear and intentional visual hierarchy also can help audiences identify and make sense of the most important information.
Thoughtful design also brings a branded experience to annual reports that plain, text-only documents lack. Custom visuals make a greater impact and help readers retain information more easily than text alone.

Adding visuals to your annual report doesn’t necessarily require major changes to the traditional report format — though outside-the-box approaches can be the most impactful and uniquely eye-catching. Some companies might opt for a digital-first approach, like an animated infographic or interactive microsite, while others might create a classic report they can share as a PDF, using a well-designed template they can update easily in future years.
“In some cases, a PDF is still going to be the best format for your annual report, but that doesn’t mean you have to do the same thing everyone else does,” said Ella Olsen, associate content writer.
“Adding visuals like illustrations, photography, data visualizations and custom graphics can make the story of your year more exciting, memorable and understandable for your audience.”
Telling your company’s story
With 12 months’ worth of growth and change, there’s a lot that makes up your company’s year. Choosing what to focus on can be challenging. Lemonly helps businesses hone their story, often touching on several common themes they might include in their annual report:
- Goals and key results: Highlight achievements and progress toward your annual goals, performance targets or long-term business priorities.
- Team highlights: Share people-related milestones like talent acquisitions, promotions and leadership development.
- Strategic vision: Summarize your plan for brand growth, major projects, culture initiatives and strategic focuses.
- Major milestones: Showcase the moments that mattered over the past year like major events, celebrations and anniversaries, awards and recognition, and sales and service milestones.
- Business growth: Recap key metrics about your sales and revenue, portfolio growth or other performance data.
- Marketing spotlight: Share highlights related to your brand, content, campaigns and external presence.
- Community impact: Spotlight the ways you’ve contributed to the world around you, including philanthropy, volunteering, grants and sponsorships, and sustainability efforts.
For annual reports that resonate, reach out to Lemonly. The team of marketers, content writers and designers can discuss how to tell the story of your year with compelling messaging and engaging visuals.