Dramatic year-over-year jobless rate comparison: From 9 percent to 2.6 percent

June 4, 2021
The year-over-over comparison of the unemployment rate in the Sioux Falls area is dramatic.
While the coronavirus pandemic began in March 2020, the effect on employment didn’t become apparent until the April report from the South Dakota Department of Labor and Regulation. The jobless rate reached 9 percent a year ago, compared with 2.6 percent this year.
The April 2020 number has been revised from a previously reported 10.5 percent, but it’s still a record for the city.
April’s unemployment rate represents 4,161 people in the metro area who are looking for work, compared with 14,175 a year ago.
In March, the rate was 3 percent.
From March to April, nonfarm wage and salaried worker levels in the Sioux Falls area rose by 1,400 people to 157,300. The largest percentage increase was the construction, mining and logging category at 13.3 percent, a gain of 1,100 workers. Leisure and hospitality saw the largest decrease at 4.6 percent, a loss of 600 workers.
Statewide, the number of nonfarm wage and salaried workers increased by 3,500 workers in April, a rise of less than 1 percent. The total of 431,100 workers remains below the pre-pandemic total of 432,400 in March 2020, but is up 9 percent compared with April 2020.
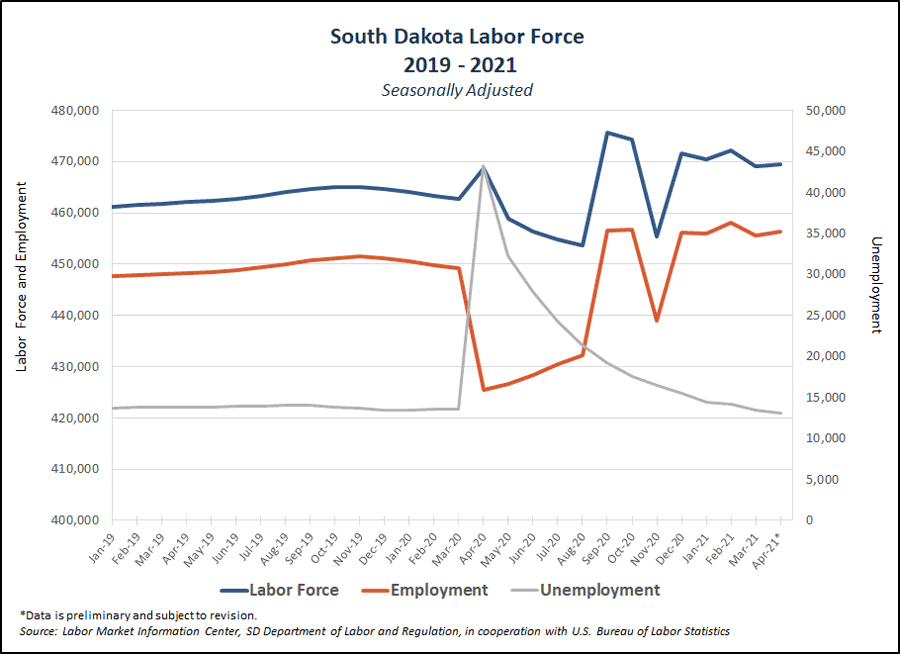
The state’s seasonally adjusted jobless rate was 2.8 percent in April, down from 2.9 percent in March. That represents 13,100 people who do not have jobs, have actively looked for one in the past four weeks and are available to work. A year ago, the rate was 9.2 percent, which is the record high, and there were 43,200 unemployed South Dakotans.
The national unemployment rate in May was 5.8 percent, compared with 13.3 percent a year ago. It was 6.1 percent in April.
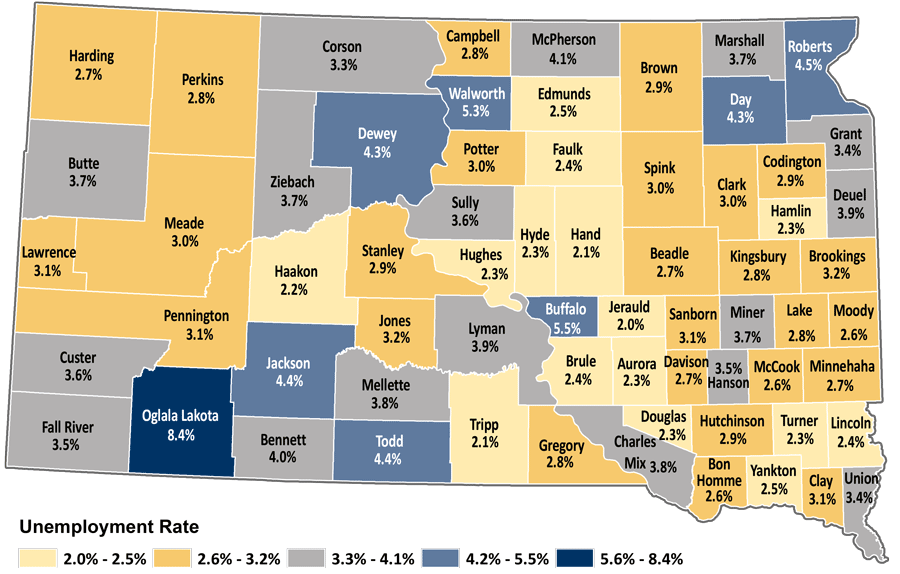
Here’s a look at unemployment rates for other cities in April compared with a year ago.
- Rapid City MSA, 3.1 percent vs. 11.9 percent.
- Aberdeen, 3 percent vs. 10.2 percent.
- Brandon, 2.2 percent vs. 6.8 percent.
- Brookings, 3.1 percent vs. 8.1 percent.
- Huron, 2.8 percent vs. 6.7 percent.
- Mitchell, 2.8 percent vs. 7.6 percent.
- Pierre, 2.4 percent vs. 7.1 percent.
- Spearfish, 3 percent vs. 17.7 percent.
- Vermillion, 3.2 percent vs. 8.1 percent.
- Watertown, 2.9 percent vs. 12.4 percent.
- Yankton, 2.6 percent vs 12.1 percent.